Global crises do not strike equally. Some are hit first. Others are hit without any defense.
Author: Karl Jochen Heinz
Location: Alzey, Germany
Date: 16 May 2025
A Global Paradox
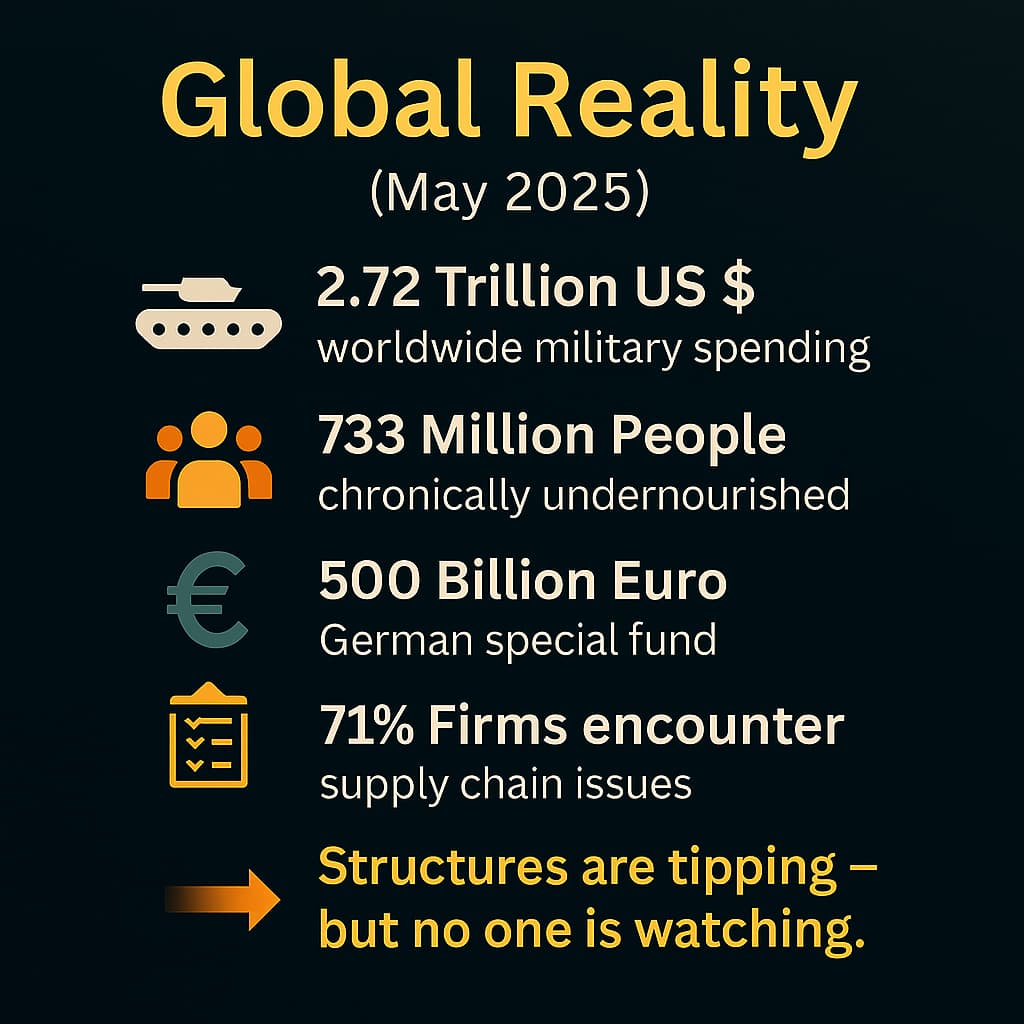
While industrialized nations debate whether 2% of GDP for NATO defense is enough –
or whether €100 billion in special military funds are appropriate –
the real fractures in global stability are already opening elsewhere.
In many regions, collapse is no longer a theoretical risk.
It is happening — where no early warning systems, no alliances, and no protection capacities exist.
Three Invisible Layers of Vulnerability
Not every region at risk is in acute danger.
But where three structural conditions overlap, systemic exposure emerges:
- High tipping pressure (climate, political, economic, societal)
- Minimal internal capacity to respond or stabilize
- Low geopolitical visibility and lack of external protection
This combination is the most dangerous —
and remains one of the least recognized patterns in global governance.
The World’s Most Vulnerable Regions
According to layered structural risk models, particularly exposed areas include:
- Sub-Saharan Africa
- South and Central Asia
- Parts of Latin America
- The Middle East
These are not places where a single problem dominates —
but where systemic breakdown meets structural powerlessness.
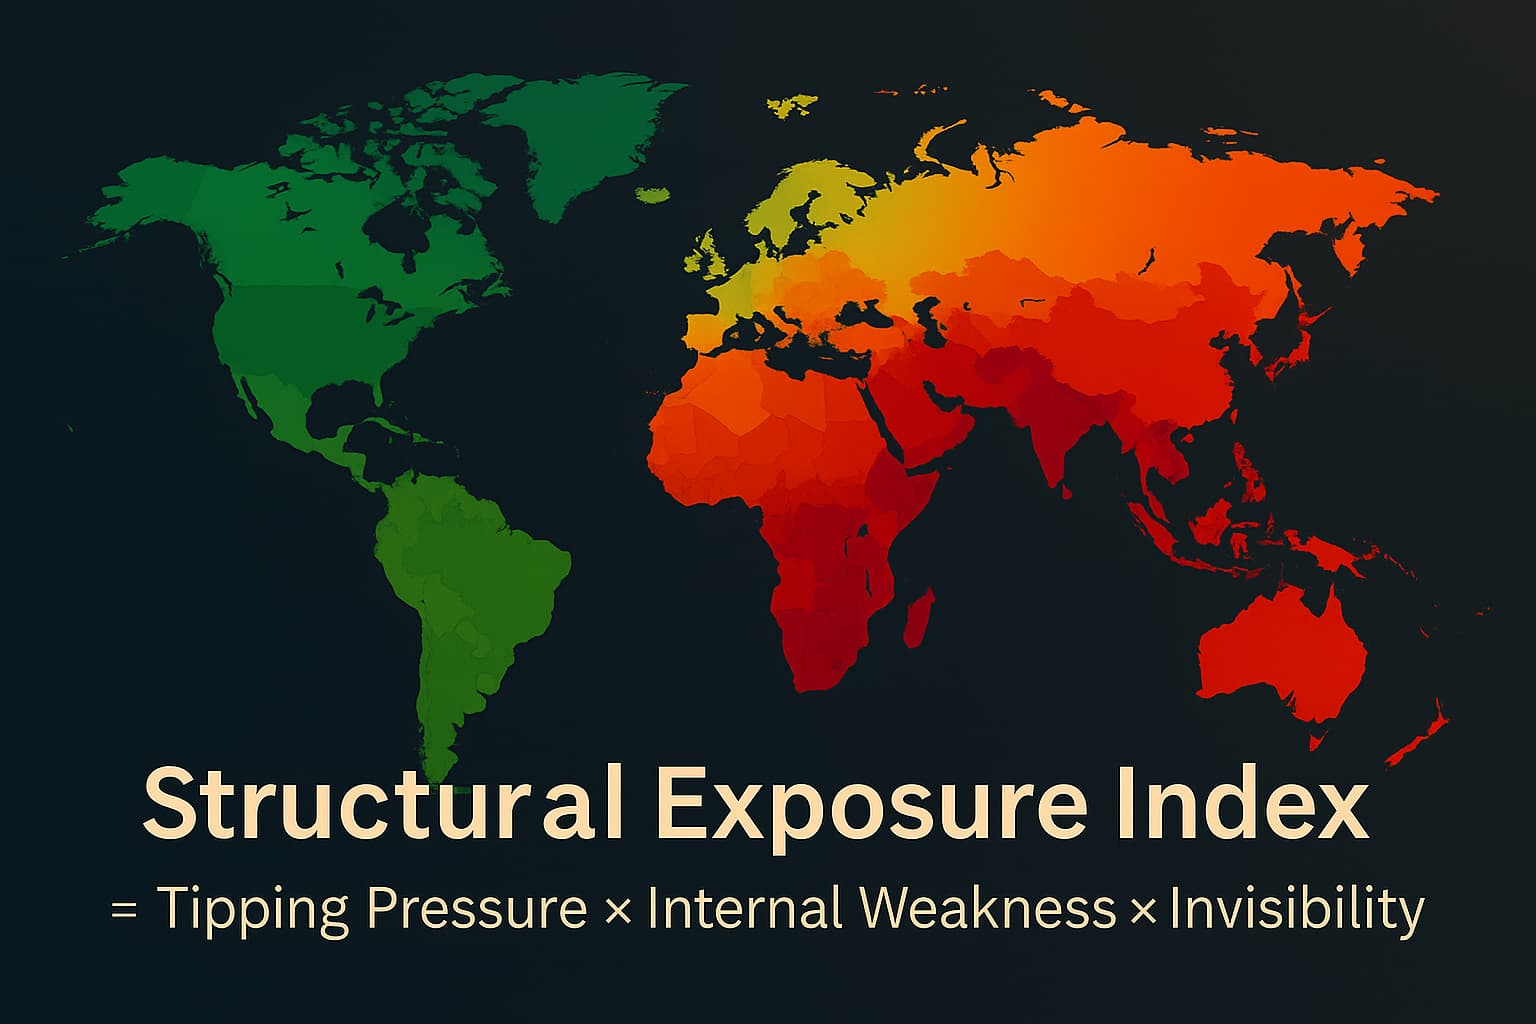
A Structural Index: Who Is Most Exposed?
To measure this form of structural vulnerability, we propose:
Structural Exposure Index = Tipping Pressure × Internal Weakness × Geopolitical Invisibility
This makes visible:
- Where instability is likely
- Who lacks resilience
- And who remains invisible in global media and politics
Countries with high index values include:
🇳🇬 Nigeria, 🇵🇰 Pakistan, 🇧🇩 Bangladesh, 🇪🇹 Ethiopia, 🇻🇪 Venezuela
Our Analysis
This is not a perspective — it is a structural diagnosis.
We synthesized over 260 indicators
from 14 international reports and 9 global databases, including:
- World Bank
- UNDP
- SIPRI
- FAO
- WHO
- IPCC
- IMF
- World Inequality Lab
- OECD Trade Index
Each factor was weighted within a normalized exposure model (ASI 1.0)
based on structural relevance, direction of tipping, and interdependence.
Result:
Where risks increase, the ability to respond and be seen decreases.
That’s not a theory — it’s a measurable global pattern.
Why This Matters – Everywhere
Some believe instability in distant regions doesn’t affect them.
But that misjudges the reality of global feedback loops:
- Crop failure → food price shocks → urban unrest
- Water scarcity → migration waves → political polarization
- State collapse → new geopolitical orders
The danger we fail to see is the one that will hit us hardest.
The Most Fragile Regions Anchor the Strongest Supply Chains
What’s often ignored:
Many of the world’s most exposed regions are vital nodes in global trade.
- Bangladesh, Pakistan, Vietnam → textiles, electronics, pharmaceuticals
- West Africa, Brazil → cocoa, coffee, soy, lithium
- Central Africa → cobalt, rare earths, copper
- Ethiopia, Sudan → agriculture, critical transit routes
If these regions tip, the impact won’t stay local:
- Factory shutdowns → delivery failures
- Food and drug shortages
- Raw material bottlenecks for green energy
- Global inflation through broken logistics
Global prosperity is built on threads that run through fragile territory.
Why South America appears less exposed
While parts of the world are already nearing critical tipping points, South America – with some exceptions – appears comparatively less exposed in our structural index. This is due to a combination of:
- Moderate climate risk in many regions (compared to areas like Sub-Saharan Africa or South Asia),
- Relative political and institutional continuity in key countries,
- Better regional food production capacities, and
- Moderate global visibility, which – though low – does not coincide with acute internal fragility.
However, this does not mean South America is immune. Environmental degradation (e.g., deforestation, water stress), social inequality, and external economic dependencies remain relevant stressors. Some subregions, particularly in the Andean and Amazonian zones, may still experience high localized vulnerability.
What Would It Cost to Prevent Collapse?
According to our model, it would take:
€2 to €5 trillion over 10 years
to stabilize the most endangered regions worldwide.
For comparison:
- Global military spending in 2023: €2.2 trillion/year
- Germany’s planned military budget: €80+ billion/year
➡️ A decade of global resilience costs less than a decade of global rearmament.
Conclusion
The true frontlines of global crisis do not run between nations —
but between structure and powerlessness.
Where no one looks, collapse begins.
Now is the time to shift from rearmament to prevention,
from blind spots to structural responsibility.
Contact
To contribute, collaborate, or share insight:
✉️ mail@project-aurora.eu
🌐 https://www.project-aurora.eu
Analysis Details (Methodology Summary)
The Structural Exposure Index (ASI 1.0) is built on:
- 260+ individual indicators
- From 14 international reports
- Covering 9 global data repositories, including:
- World Bank
- UNDP
- SIPRI
- FAO
- WHO
- IPCC
- IMF
- World Inequality Lab
- OECD Trade Index
Indicators were categorized into 5 core dimensions:
1. Climatic Tipping Pressure
- Water stress
- Land degradation
- Regional temperature rise
- Frequency of extreme weather
- Agricultural land loss
- Biodiversity ecosystem decline
2. Socioeconomic Resilience
- GDP per capita
- Poverty and hunger rates
- Literacy and education levels
- Access to healthcare
- Informal labor rate
- Debt vs. fiscal maneuverability
3. Political & Institutional Stability
- Corruption perception
- Democracy index (Freedom House, V-Dem)
- Rule of law
- Frequency of armed conflict
- Institutional climate resilience
- Press freedom and information access
4. Trade & Resource Dependency
- Export reliance on critical resources
- Export diversification
- Integration in global value chains
- Infrastructure vulnerability (ports, corridors)
- Role in key supply flows (e.g. rare earths, food, electronics)
5. Geopolitical Visibility & Protection
- Representation in global institutions
- Media attention in crises
- Security alliances
- Development & disaster aid
- Proximity to major geopolitical zones
All values were normalized and integrated into the ASI 1.0 exposure model —
designed to reflect not opinion, but measurable structural truth.
🧭 This model is freely available upon request for academic, policy, or media collaboration.